Overscheduling: Difference between revisions
From Guide to YKHC Medical Practices
mNo edit summary |
mNo edit summary |
||
| (2 intermediate revisions by the same user not shown) | |||
| Line 5: | Line 5: | ||
For different no-show rates and different numbers of appointments, the likelihood of a certain number of patients showing up can be probabilistically modeled.<br> | For different no-show rates and different numbers of appointments, the likelihood of a certain number of patients showing up can be probabilistically modeled.<br> | ||
<br> | <br> | ||
'''Second-order approximation (bootstrap method)'''<br> | '''Second-order approximation (bootstrap method, 10,000 days)'''<br> | ||
Assumptions: | Assumptions: | ||
# Each patient has the same likelihood to no-show.<br> | # Each patient has the same likelihood to no-show.<br> | ||
# The likelihood that each patient is a no-show is statistically independent of the likelihood of no-show of the other patients.<br> | # The likelihood that each patient is a no-show is statistically independent of the likelihood of no-show of the other patients.<br><br> | ||
<br> | |||
In the table below, the columns show increasing no-show rates (10% thru 60%) and the rows show increasing numbers of patients scheduled (6 thru 12).<br> | |||
<br> | |||
{| class="wikitable" | {| class="wikitable" | ||
|- | |- | ||
! | ! | ||
! | ! 10% | ||
! | ! 20% | ||
! | ! 30% | ||
! | ! 40% | ||
! | ! 50% | ||
! | ! 60% | ||
|- | |- | ||
| 6<br /> | | 6<br /> | ||
| Line 30: | Line 34: | ||
|- | |- | ||
| 7 | | 7 | ||
| | | [[File:Overscheduling 07 10.pdf|300px]] | ||
| | | [[File:Overscheduling 07 20.pdf|300px]] | ||
| | | [[File:Overscheduling 07 30.pdf|300px]] | ||
| | | [[File:Overscheduling 07 40.pdf|300px]] | ||
| | | [[File:Overscheduling 07 50.pdf|300px]] | ||
| | | [[File:Overscheduling 07 60.pdf|300px]] | ||
|- | |- | ||
| 8 | | 8 | ||
| | | [[File:Overscheduling 08 10.pdf|300px]] | ||
| | | [[File:Overscheduling 08 20.pdf|300px]] | ||
| | | [[File:Overscheduling 08 30.pdf|300px]] | ||
| | | [[File:Overscheduling 08 40.pdf|300px]] | ||
| | | [[File:Overscheduling 08 50.pdf|300px]] | ||
| | | [[File:Overscheduling 08 60.pdf|300px]] | ||
|- | |- | ||
| 9 | | 9 | ||
| | | [[File:Overscheduling 09 10.pdf|300px]] | ||
| | | [[File:Overscheduling 09 20.pdf|300px]] | ||
| | | [[File:Overscheduling 09 30.pdf|300px]] | ||
| | | [[File:Overscheduling 09 40.pdf|300px]] | ||
| | | [[File:Overscheduling 09 50.pdf|300px]] | ||
| | | [[File:Overscheduling 09 60.pdf|300px]] | ||
|- | |- | ||
| 10 | | 10 | ||
| | | [[File:Overscheduling 10 10.pdf|300px]] | ||
| | | [[File:Overscheduling 10 20.pdf|300px]] | ||
| | | [[File:Overscheduling 10 30.pdf|300px]] | ||
| | | [[File:Overscheduling 10 40.pdf|300px]] | ||
| | | [[File:Overscheduling 10 50.pdf|300px]] | ||
| | | [[File:Overscheduling 10 60.pdf|300px]] | ||
|- | |- | ||
| 11 | | 11 | ||
| | | [[File:Overscheduling 11 10.pdf|300px]] | ||
| | | [[File:Overscheduling 11 20.pdf|300px]] | ||
| | | [[File:Overscheduling 11 30.pdf|300px]] | ||
| | | [[File:Overscheduling 11 40.pdf|300px]] | ||
| | | [[File:Overscheduling 11 50.pdf|300px]] | ||
| | | [[File:Overscheduling 11 60.pdf|300px]] | ||
|- | |- | ||
| 12 | | 12 | ||
| | | [[File:Overscheduling 12 10.pdf|300px]] | ||
| | | [[File:Overscheduling 12 20.pdf|300px]] | ||
| | | [[File:Overscheduling 12 30.pdf|300px]] | ||
| | | [[File:Overscheduling 12 40.pdf|300px]] | ||
| | | [[File:Overscheduling 12 50.pdf|300px]] | ||
| | | [[File:Overscheduling 12 60.pdf|300px]] | ||
|} | |} | ||
<br> | |||
<br> | |||
'''Limitations''' | |||
# In reality, the patient no-show probability is only partially statistically independent but also partially statistically linked (i.e. via the weather). | |||
<br> | |||
<br> | |||
Latest revision as of 00:00, 28 October 2021
Definition: to schedule in excess of capacity.
Purpose: to achieve the desired productivity when a substantial percentage of patients are expected to be no-shows (i.e. not show up for their appointment).
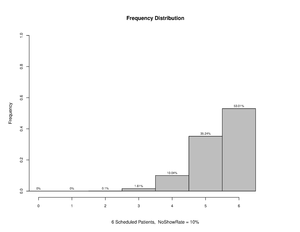
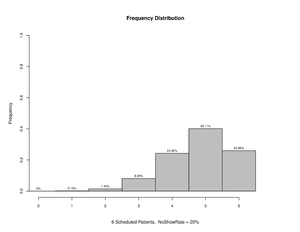
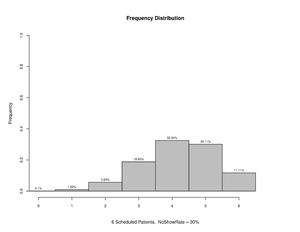
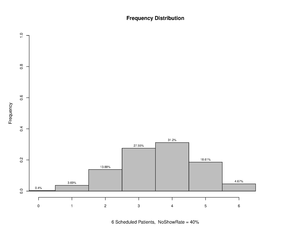
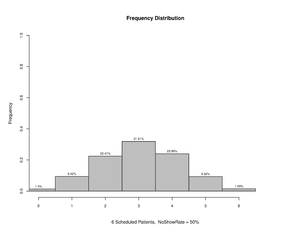
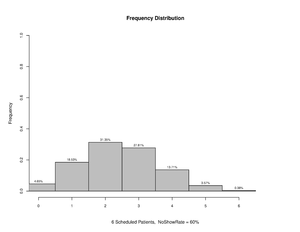
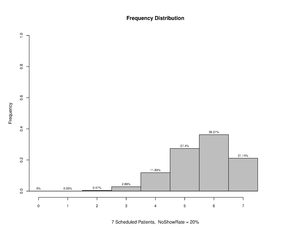
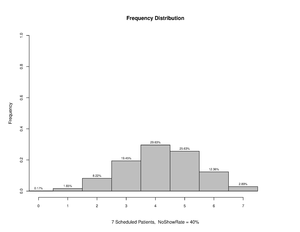
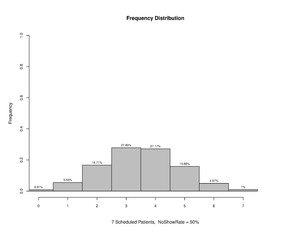
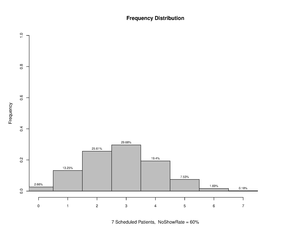
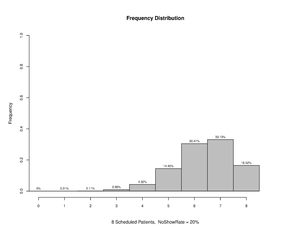
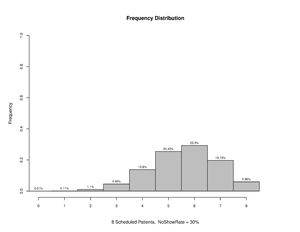
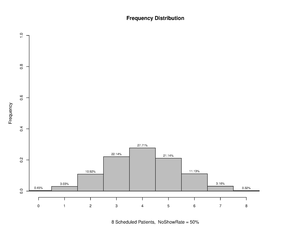
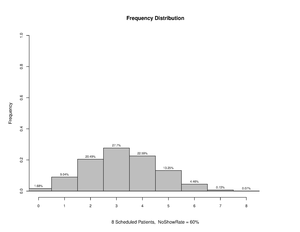
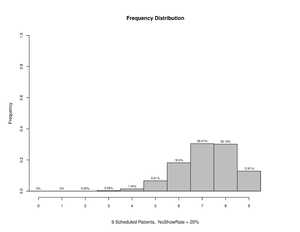
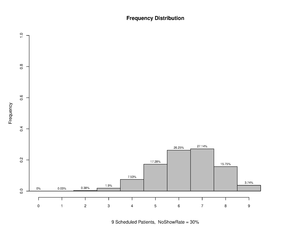
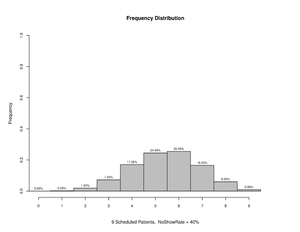
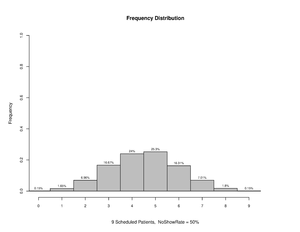
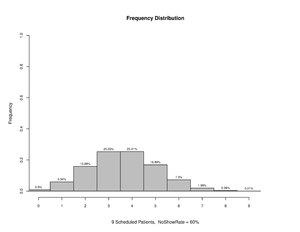
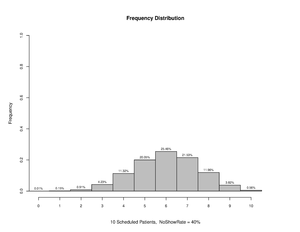
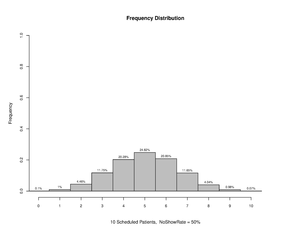
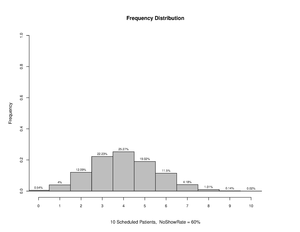
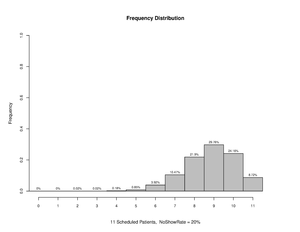
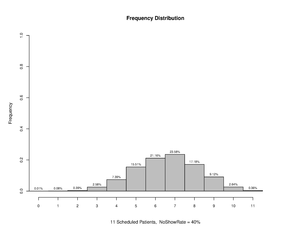
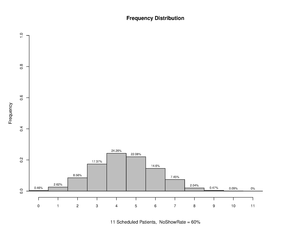
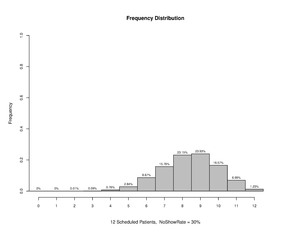
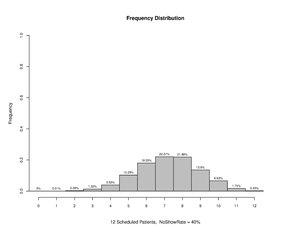
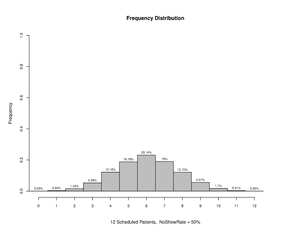
For different no-show rates and different numbers of appointments, the likelihood of a certain number of patients showing up can be probabilistically modeled.
Second-order approximation (bootstrap method, 10,000 days)
Assumptions:
- Each patient has the same likelihood to no-show.
- The likelihood that each patient is a no-show is statistically independent of the likelihood of no-show of the other patients.
In the table below, the columns show increasing no-show rates (10% thru 60%) and the rows show increasing numbers of patients scheduled (6 thru 12).
| 10% | 20% | 30% | 40% | 50% | 60% | |
|---|---|---|---|---|---|---|
| 6 |
|
|
|
|
|
|
| 7 | 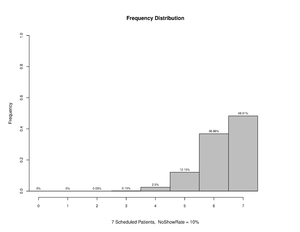
|
|

|
|
|
|
| 8 | 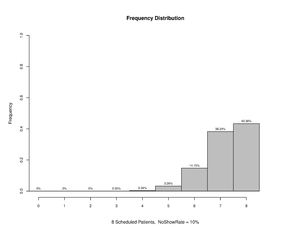
|
|
|

|
|
|
| 9 | 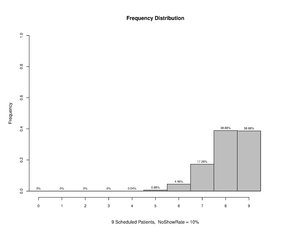
|
|
|
|
|
|
| 10 | 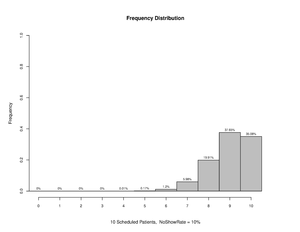
|

|

|
|
|
|
| 11 | 
|
|

|
|

|
|
| 12 | 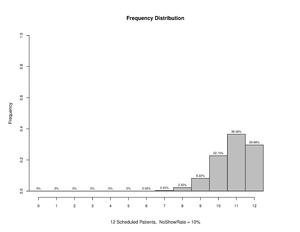
|

|
|
|
|

|
Limitations
- In reality, the patient no-show probability is only partially statistically independent but also partially statistically linked (i.e. via the weather).